
The number of Covid cases in recent times has been on the rise…

Equity markets have become more volatile on concerns of the 2nd wave of Covid impacting India’s economic recovery…

The media is busy fighting the who-makes-the-scariest-headlines competition…


Now, when all this happens in tandem, we get a nagging thought…
Is this the start of a market correction?
Get a cup of coffee and let us deep dive to figure out the answer…
What is supposed to be ‘Normal’ in Equities?
Equity Markets are Volatile.
But simply stating this statement is akin to me watching a Korean movie without subtitles. While broadly I can make out what is happening in the movie, I have no clue on the specifics.
When someone says “Equity markets are volatile”, what we really hear is “They go up and down”. We are happy with the ‘up’ part – after all, that is why we invest in equities and nothing to complain about.
But the ‘down’ part is where the problem lies. The vague and fancy term VOLATILITY doesn’t tell us what degree of ‘down’ is supposed to be ‘normal’ vs ‘not-so-normal’.
So this leads us to another simple question –
What degree of MARKET FALL is supposed to be NORMAL?
The simplest way to understand this is to refer to the past behavior of equity markets.
So, we went back as long as 40+ years (from the time Sensex was launched) and decided to check for the largest fall recorded during each year i.e the fall from the highest index value to the lowest index value during the year.
Here is what we found…

Did you notice something strange…
Equity markets had a fall EACH & EVERY YEAR!
You read it right – EACH & EVERY YEAR. There was not a single year where the markets did not have a decline.
Let us add more context to the numbers…
- A 10-20% fall was almost a given every year.
- There were only 3 out of 41 years (represented by the yellow bars) where the intra-year fall was less than 10%.
But here is where it gets interesting…
Despite the equity markets going down every year this is how the long term returns panned out.

I can guess your reaction

But why does this happen…
Equity investing for the long term finally boils down to human progress and entrepreneurship. We are simply betting that entrepreneurs (who take a higher risk) on aggregate will get compensated with higher returns in the long run.
Thanks to the ingenuity of Indian entrepreneurs, Indian equity markets have always recovered from market crashes and continued to perform in the long run.

But what about the first chart, where markets had a fall every year?
Let me add one more additional data to the chart. While I showed you the highest intra-year fall, I didn’t show how the year finally ended in terms of returns.
So here you go…

Aah! Now that adds the much needed nuance.
Out of 41 years, while markets always had an interim decline, only in 9 years did the market end the year with negative returns. In other words, for 32 out of 41 years, the markets ended the year in positive – despite the temporary decline in between.
So it is not as scary as it initially looked.
Based on the new information, let us slightly tweak our earlier views.
Previous View: 10-20% fall is almost a given every year.
New Nuanced View: 10-20% TEMPORARY fall is almost a given every year.
Translating all this into english, here is what this means for us –
10-20% temporary decline in equities is as common as our birthdays!
So this essentially means occurrences of 10-20% temporary declines are normal and we should in fact be surprised if they don’t happen.
The Sensex touched a peak of roughly 52,000 a few months back.
Since a 10-20% intra-year decline in equities is common, Sensex falling to 47,000-42,000 levels should be a normal part of expectations.
Where is the Sensex now?
Around 47,500 levels…
Is this something about which we should be surprised?
While the media will be out there trying to scare the daylights out of you, as seen from the 40 year history, you now know that this is perfectly normal behavior from equities.
Even if markets go down further and drop to Sensex levels between 47,000 to 42,000, this is perfectly normal behavior from equities and most importantly we shouldn’t be surprised or scared. This is a part of normal expectation from equity markets.
This is how we put volatility into context.
But, hey hang on. You have another question.
What about the ‘Not-So-Normal Declines’ in Equities?
Once every 7-10 years, equity markets also witness a sharp temporary fall of 30-60%.
Historically, during such deep temporary falls, it has taken around 1-3 years for the markets to recover and get back to original levels. In the worst case scenario, it has taken upto 5 years for the recovery.

Translating that to Sensex values,
History tells us that, in the worst case, a sharp bear market correction can also bring the Sensex levels between 36,000 to 21,000 (30-60% temporary decline).
But this is where it gets tricky.
The question now is:
All the 30-60% falls should logically start from a small 10-20% decline. How do I know which is ‘Normal Decline’ and which one is actually the start of the big one?
How do we find out if this decline is going to be the big one?
Now if we figure this out, our lives are sorted.
We can peacefully stay invested for all the temporary 10-20% declines. But if there is going to be a large ‘not-so-normal’ decline, we can move out of the markets and enter back at the bottom.
Perfect.
But…How do we find out which 10-20% decline is going to be the big one?
Before we embark upon this endeavor, let us find out the best investors who have done this and try to learn from them.
But there seems to be an issue.
Can you name 5 investors who have ‘consistently’ identified bear markets, stepped out before the fall, and entered back at the bottom?
In fact I had posted the same question on my twitter feed here.
You can take all the time you want. If you are finding it difficult to find even one name – no worries.
You already have your answer.
While it is extremely difficult to accept this, you have discovered the humble truth.
Now while both you and I are not able to find out the answer. There still must be someone who can predict a market fall. Fair point. Instead of trusting either me or you, let us hear out someone whose entire life revolved around this question.
Here is an honest confession by one of India’s most popular business channel anchors, who in essence spent his entire life asking experts for their view on what will happen to markets.
Want more proof…
Sample this…


and here we go again in the recent crash…

This is just a small illustration and the list of market predictions going wrong is endless.
The legendary investors also seem to agree
“The idea that a bell rings to signal when investors should get into or out of the market is simply not credible. After nearly 50 years in this business, I do not know of anybody who has done it successfully and consistently.”
– Jack Bogle
“Far more money has been lost by investors preparing for corrections, or trying to anticipate corrections, than has been lost in corrections themselves.”
– Peter Lynch
“The years ahead will occasionally deliver major market declines – even panics – that will affect virtually all stocks. No one can tell you when these traumas will occur.”
– Warren Buffet
Now after seeing all this evidence, if you still expect yours faithfully to tell you exactly when a large market correction will happen, then I have failed in my duty to set the right expectations.
So does it mean, we stay invested in equities at all points in time irrespective of the market conditions?
While timing large market falls is extremely difficult, here is where we like to bring in some nuance.
What is our approach?
We take a humble yet pragmatic approach where around 90% of the time we stick to the view that we cannot predict equity markets.
But for the 10% times when markets are at their extremes (as per our framework) we would like to adjust and adapt our portfolios to a certain extent.
The keyword here is ‘to a certain extent‘ – as bubble markets may last much longer than we expect or we may be wrong in our judgement of what constitutes an ‘extreme’. Hence we don’t take extreme ‘all-in’ or ‘all-out’ decisions from equities.
So, when do we reduce equity allocation?
When we studied past bear markets, we noticed that the odds of a large market correction is high when three conditions come together
- Very Expensive Valuations
- High Earnings Growth over the last 5-7 years
- Euphoric Sentiments
In other words, the odds of a 10-20% correction converting into the big dreaded one is pretty high under these conditions.
Under these extreme conditions, we prefer to underweight equities (read as reduce equity allocation) and shift a portion to Dynamic Asset Allocation funds.
You can read the entire thought process and our framework here.
What about the current markets?
Here is how our framework evaluates the current markets
- Valuations
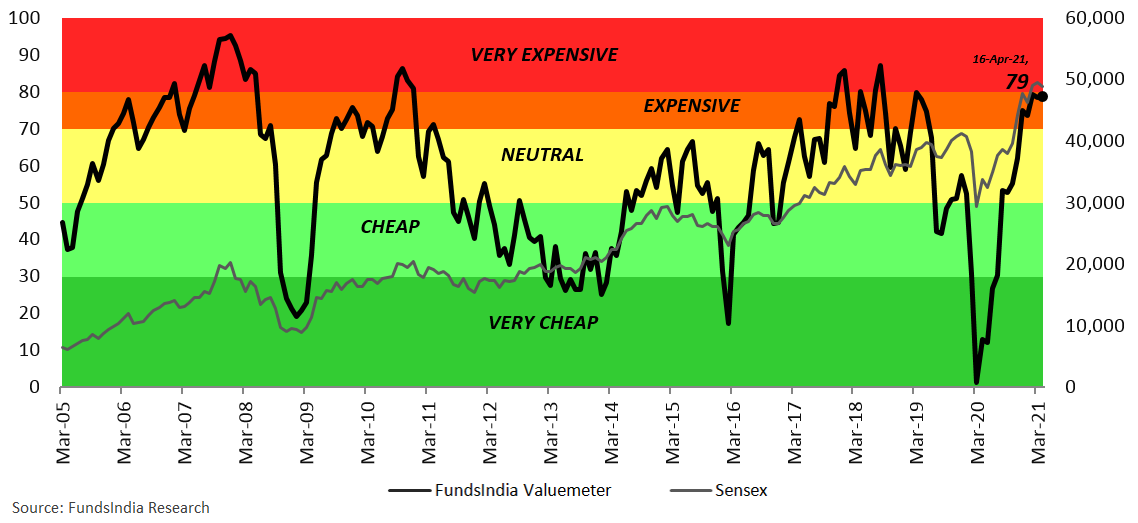
- View: Valuations are in the expensive zone
- Why?
- Our in-house valuation indicator FI Valuemeter based on MCAP/GDP, Price to Earnings Ratio, Price To Book ratio and Earnings Yield to Bond Yield indicates value of 79 i.e Expensive Zone (as on 16-Apr-2021)
- Earnings Growth
- View: Bottom of Earnings Growth Cycle – high odds of above average earnings growth in the next 5 years
- Why?
- We expect a gradual pick up in earnings growth – Initial signs of Economic Recovery, Low earnings base, Cost Control measures, Low interest rates, Consolidation of Market Share for market leaders, Govt Reforms (Lower corporate tax, Labour Reforms, PLI Schemes), Rural economy doing well, Banking System Stress – not as bad as feared & early signs of pick up in real estate sector. Recent Budget’s strong focus on infra spending and several reforms announced (Bad bank, Development Finance Institution, Privatization, Disinvestment, Asset monetization) augurs well for earnings growth recovery.
- 2nd wave of Covid and subsequent lockdowns remains the key risk to the view in the near term.
- Sentiments
- View: Neutral – Mixed Signals
- Why?
- FII Flows are super strong while DII flows are negative – both being very high would have been a concern – early signs of this trend reversing
- Past 3-5Y Returns are in the 13-15% CAGR – No signs of euphoria as the past returns at the current juncture is no where close to what investors experienced in the 2003-07 bull markets (45%+ CAGR)
- IPOs – No signs of euphoria yet. However the no of IPOs are picking up and most of them are getting oversubscribed.
- Retail Participation in direct stocks – entering euphoric zone
So putting all these together, our framework suggests that we are not in an extreme bubble-like market scenario.
We continue to remain neutral on equities i.e neither underweight or overweight equities at the current juncture. In other words, if your original long term asset allocation is 50% equities and 50% debt, continue with 50% equity allocation – don’t make it say 30% or 70%.
While valuations no doubt are definitely expensive, only when other two indicators i.e earnings growth cycle picks up and sentiments turn euphoric (i.e both FII and DII flows become very high) will we look at reducing equity exposure.
You would have also noticed that we are extra cautious when it comes to underweighting equities and much more aggressive in increasing equity allocation during market falls (check here).
This is because…
- Your original split between equities and debt already has built in a layer of defence via the debt allocation and takes into account the extent of decline you are willing to tolerate (as per your risk tolerance). The underweight position (whenever we decide to go for it) will be over and above that and hence needs to account for that and will be done only in market extremes.
- As the markets are generally up over the long term, the odds are against us when we go underweight
- As seen from evidence, it is extremely difficult to get the timing right on bubbles as the markets can remain expensive and continue to go up for a long time. Even the best of investors have got it wrong.
So putting all this together, at the current juncture as per our framework the odds of a 10-20% decline converting into a large market crash is very low.
But what if markets end up with a huge crash?
Just because our framework is not indicating a bubble doesn’t mean the market can’t have a big fall. Remember all the experts who tried being overconfident.
We completely acknowledge this possibility.
The way we think through this is…
Just like how you can meet with an accident both at driving speeds of 150 km/hour and 70 km/hour, our framework is only meant to try and prepare for the accidents at extreme speeds say 150 km/hr. The accidents at 70 km/hr will get addressed via your original asset allocation (remember this is why we have a debt portion).
The idea is to focus on risks under our control – valuation, earnings growth cycle and sentiments. However, unknown event driven risks like Covid last year etc are tough for any framework to predict in advance.
A 10-20% fall would be considered as normal equity market volatility and requires no major action. However if there is a larger fall, we suggest having a clearly pre-defined plan which can help you take advantage of the fall without panicking.
While we think the odds are low, however we always want to be prepared to make use of the opportunity if the market falls more than 20%.
Prepare a ‘What if things go wrong ’ plan
Here is how a sample plan looks like:
Pre-decide a portion of your debt allocation (say Y) to be deployed into equities if in case market corrects
- If Sensex Falls by ~20% to ~41,000 – Move 20% of Y into equities
- If Sensex Falls by ~30% to 36,000 – Move 30% of Y into equities
- If Sensex Falls by ~40% to 31,000 – Move 40% of Y into equities
- If Sensex Falls by ~50% to 26,000 – Move remaining portion from Y into equities
*This is a rough plan and can be adapted to based on your own risk profile
For eg: If you have a Rs 1 cr portfolio with a 50% Equity and 50% Debt Allocation. Assume you have demarcated 30% Debt Portfolio (i.e 30 lakhs) to be deployed into equities if in case market corrects –
- If Sensex Falls by ~20% to ~41,000 – Move 20% i.e Rs 6 lakhs from Debt into equities
- If Sensex Falls by ~30% to 36,000 – Move 30% i.e Rs 9 lakhs from Debt into equities
- If Sensex Falls by ~40% to 31,000 – Move 40% i.e Rs 12 lakhs from Debt into equities
- If Sensex Falls by ~50% to 26,000 – Move remaining Rs 3 lakhs from Debt into equities
This helps us to make peace with our portfolios and the unpredictable markets.

Instead of perennially worrying that every 10-20% decline might become the big one, the framework helps us reduce equity allocation only at extreme bubble-like conditions (which also is very rare). Rest of the time, we continue to stay invested as per long term asset allocation plan and at the same time mentally prepared with the leeway to invest aggressively if there is a market fall of more than 20%.
So if you still haven’t built your ‘what-if-things-go-wrong’ plan, this is the best time to do it.
Summing it up
- What degree of MARKET FALL is supposed to be NORMAL?
- There is not a single year where the markets did not have a decline
- But, Indian markets have always recovered from these declines and have continued to go higher in the long run
- A 10-20% temporary decline is almost a given every year
- Sensex falling to 47,000-42,000 levels should be a normal part of expectations
- What about the ‘Not-So-Normal Declines’ in Equities?
- Once every 7-10 years, equity markets also witness a sharp temporary fall of 30-60%
- Historically, during such deep temporary falls, it has taken around 1-3 years for the markets to recover and get back to original levels. In the worst case scenario, it has taken upto 5 years for the recovery.
- How do we find out if this decline is going to be the big one?
- It is impossible to consistently time the markets – i.e step out before a large market fall and enter back at the bottom
- Even the best investors have got it wrong several times
- FundsIndia Approach
- We take a humble yet pragmatic approach where around 90% of the time we stick to the view that we cannot predict equity markets
- But for the 10% times when markets are at their extremes (as per our framework) we would like to adjust and adapt our portfolios to a certain extent.
- The odds of a bear market is high when three conditions come together – Very Expensive Valuations + High Earnings Growth over the last 5-7 years + Euphoric Sentiments
- Current View:
1) Valuations – Expensive
2) Earnings Growth – Bottom of Earnings Growth Cycle – high odds of above average earnings growth in the next 5 years
3) Sentiment – Neutral - While valuations no doubt are definitely expensive, only when other two indicators i.e earnings growth cycle picks up and sentiments turn euphoric (i.e both FII and DII flows become very high) will we look at reducing equity exposure.
- So putting all this together, at the current juncture as per our framework the odds of a 10-20% decline converting into a large market crash is very low.
- But what if markets end up with a huge crash?
- We will take advantage of the large fall using ‘what-if-things-go-wrong’ plan.