Last week, we discussed the concept of divergence between the RSI and price action and discussed a few practical problems associated with it from a trading perspective. This week, we shall discuss how to use of the Bollinger Band tool and RSI to spot high probability reversal trades. As always, please remember that we are discussing the entry aspect of the trade. The stop loss and targets are the other key variables to the equation that should be borne in mind while considering trade decisions.
Have a look at the daily chart of Sesa Goa featured below. Notice the positive divergence between the price action and RSI. The question is how to identify or confirm if the divergence can be relied upon.
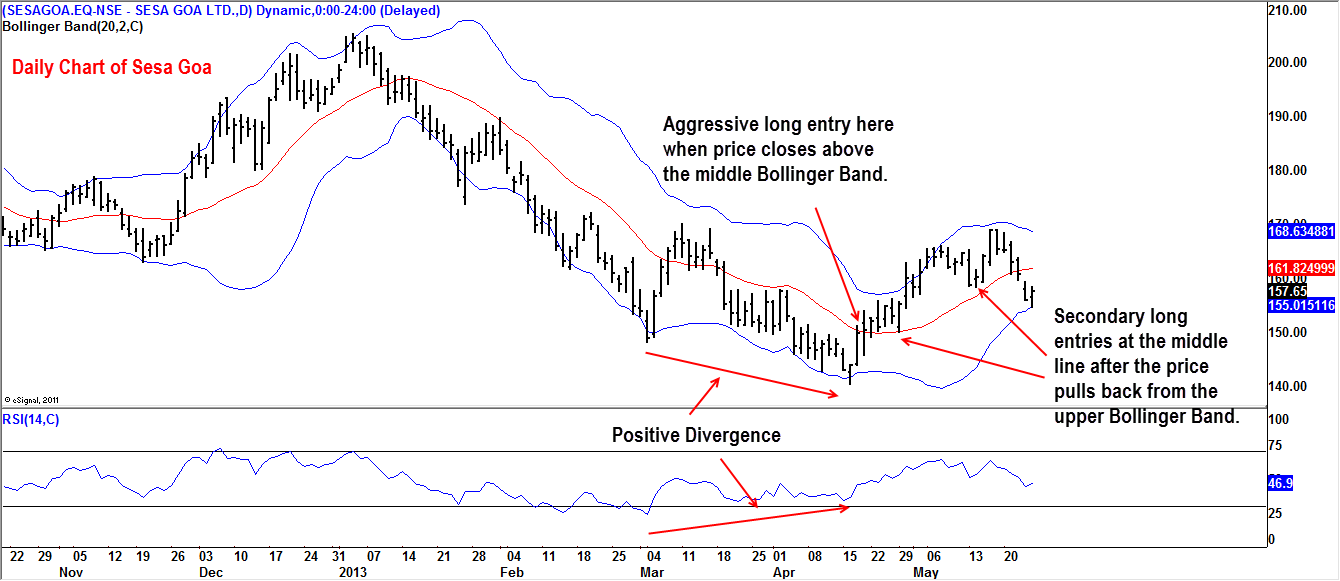
It is in this context that the Bollinger Bands come into play. Typically, price tends to stay in the upper or lower band of the Bollinger Band in a strong trending move. In a strong uptrend, price would seldom tread to the lower half of the Bollinger Band and vice-versa. We can use this information to our advantage.
In Sesa Goa, after the positive divergence in RSI, price moved above the middle line or the 20-day moving average of the Bollinger Band and also almost hit the upper Bollinger Band. This is a strong signal that there is at least a temporary reversal of the prior downtrend.
There are two entries that we can consider depending on the trading style. The aggressive traders may consider long positions when the price closes above its 20-day moving average (which is also the middle line of the Bollinger Band). A secondary entry could be a pull back to the middle Bollinger Band line after price nears or hits the Bollinger Band on the opposite side. In this case, the secondary long entry would have been triggered on April 29 when price pulled back to the middle line of the Bollinger Band after having hit the upper line of the Bollinger Band.
Have a look at Daily Chart of Axis Bank featured below. The same concept is at play on the other side.
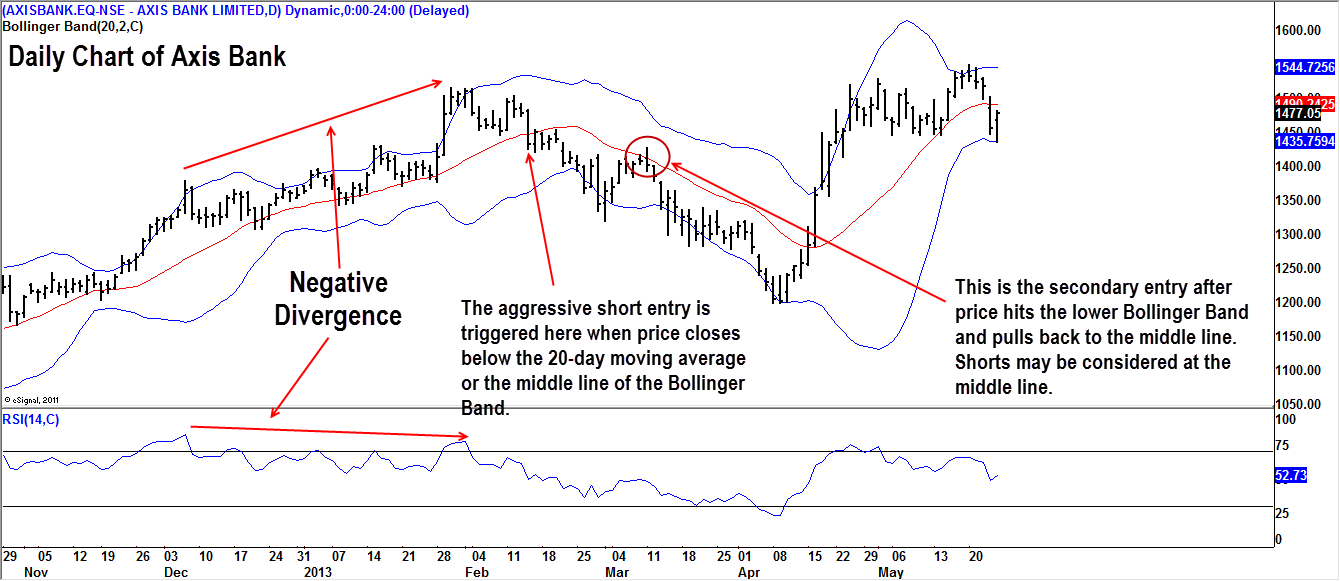
Please be reminded that the first entry is bit more aggressive while the secondary entry would be more reliable but would be at a slightly inferior price location in relation to the first entry.
It is not our intention to dish out a trading system or methodology here. We are trying to channelize the thought process to identify high probability trade entries. There is no hard and fast rule here. The basic idea is to look for some additional evidence and reason to consider a counter-trend trade.
The concept would be covered with more examples next week.