DSP Quant Fund – A deep dive into the product, process and portfolio
The Product
DSP Quant Fund falls under the umbrella of ‘quant funds’. Before discussing the specifics of DSP Quant Fund, let us get into a brief introduction to Quant Funds first.
Quant Funds are funds where the investment decisions are driven by a set of predefined rules. These rules are built by the quantitative research team based on long term investment principles, proven investment factors and rigorous back testing.
The involvement of the human element in these funds are mostly in the design phase and occasional review of the models. This actually prevents the stock selection of the fund from getting influenced by human biases – thereby operating in the middle ground between active and passive investing.
DSP Quant Fund builds its portfolio by following a rule based investment process with minimal human interference. These set of rules or factors are built into a quantitative model – using which investment decisions are made.
The Process
The model tries to find ‘good companies’ by following the below three step process.
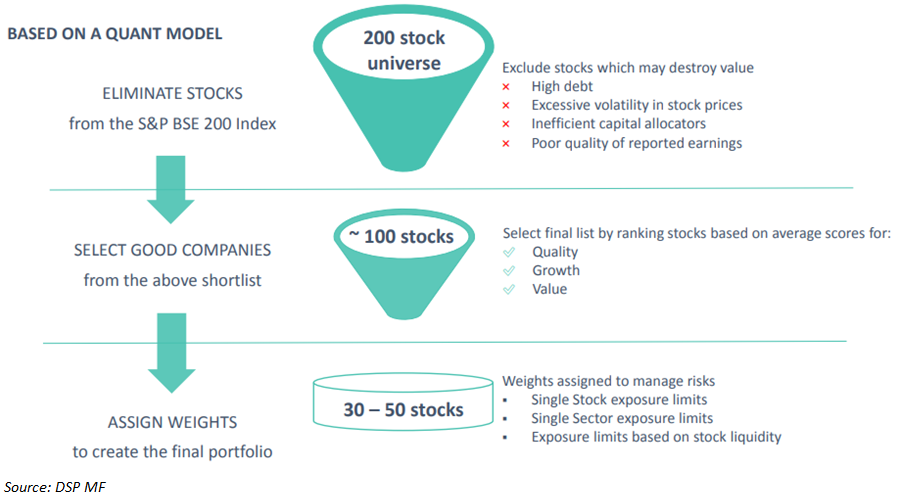
As can be seen from the above image, the DSP Quant Fund eliminates those companies from the BSE 200 bucket with high debt, high price volatility, poor management and earnings quality. Following the elimination stage, the model picks the companies that generate good return on equity, are relatively inexpensive and hold strong growth prospects. The selected stocks are optimized by assigning weights based on the factor scores to build the final portfolio.
The Portfolio
Final portfolio consists of 30 to 50 stocks with limited concentration to a single stock/sector in order to ensure adequate liquidity and achieve diversification.
Since DSP Quant Fund considers S&P BSE 200 as its universe, it has a large cap orientation. The portfolio is rebalanced semi-annually.
As the investment decisions are made based on a predefined set of rules incorporated into the model, DSP Quant Fund does very well in mitigating human biases.
Solid outperformance in the simulated past as well as in the actual present
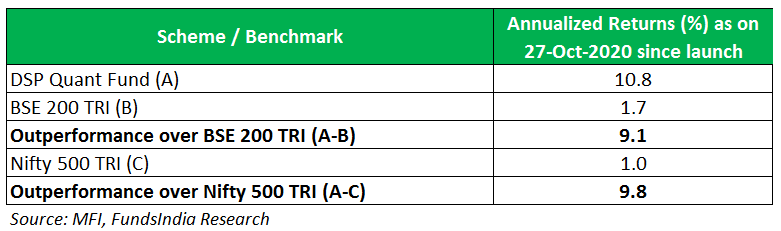
Solid Outperformance since launch
DSP Quant Fund has delivered an outperformance of 9.1% and 9.8% over BSE 200 TRI and Nifty 500 TRI since the fund’s launch in Jun-2019.
Though 15 months is too short a timeframe to evaluate an equity fund’s performance, given that it is a rule based model, we can check for the backtested performance across the last 15 years.
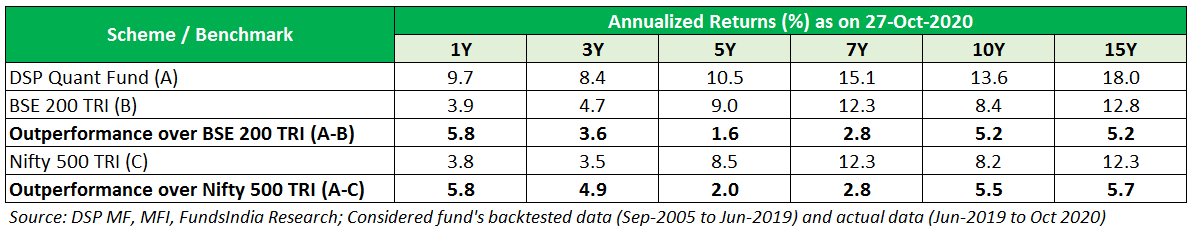
The fund’s outperformance is evident even in the backtested results as shown above. Over the last 15 years the fund has delivered an outperformance of more than 5% vs the benchmark.
But has the performance been consistent?
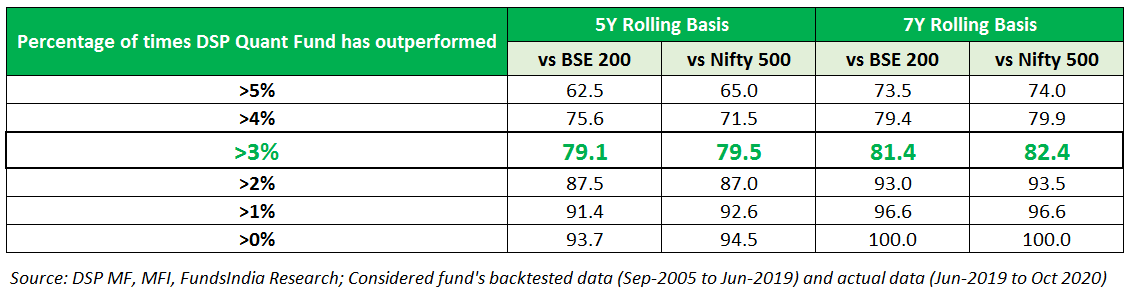
To test that, we also calculated the rolling returns using the backtested data (from Sep-2005 till the actual launch of the fund in Jun-19) and the actual data post Jun-19. The below table shows that, on average, DSP Quant Fund has outperformed the benchmark indices by more than 6% on a five-year and seven-year rolling basis.
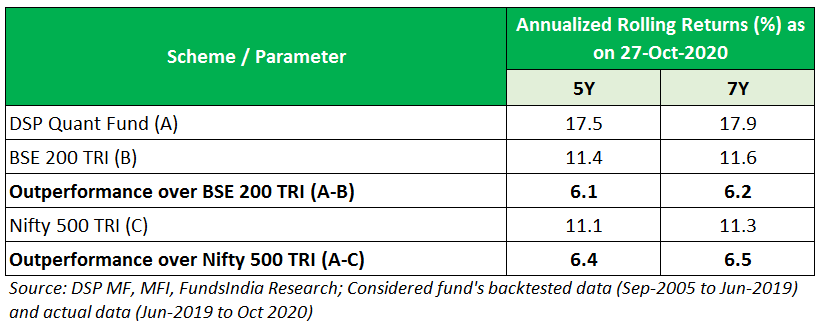
DSP Quant Fund has managed to beat the BSE 200 and Nifty 500 TRI around 94% of the times on a five-year rolling basis and 100% of the times on a seven-year rolling basis. And the fund has delivered an outperformance of more than 3% almost 80% of the times on five-year and seven-year rolling basis.
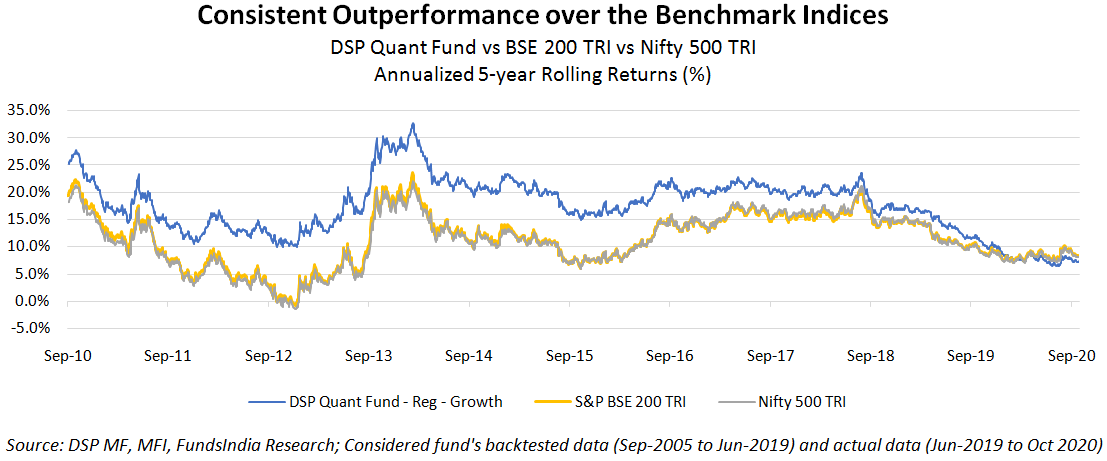
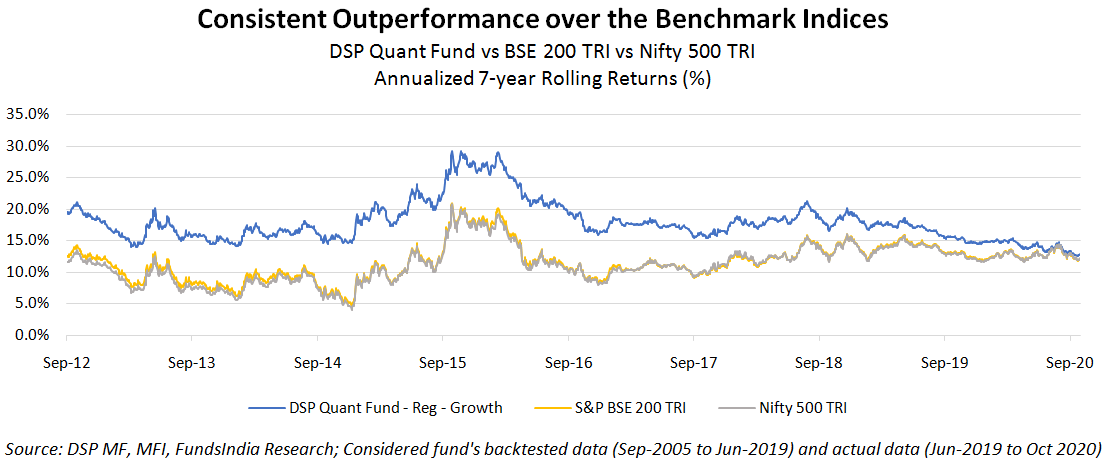
The rolling returns charts below give us a glimpse on the quant model’s effectiveness and consistency in outperformance across cycles.
Returns are good and consistent. But what about risks?
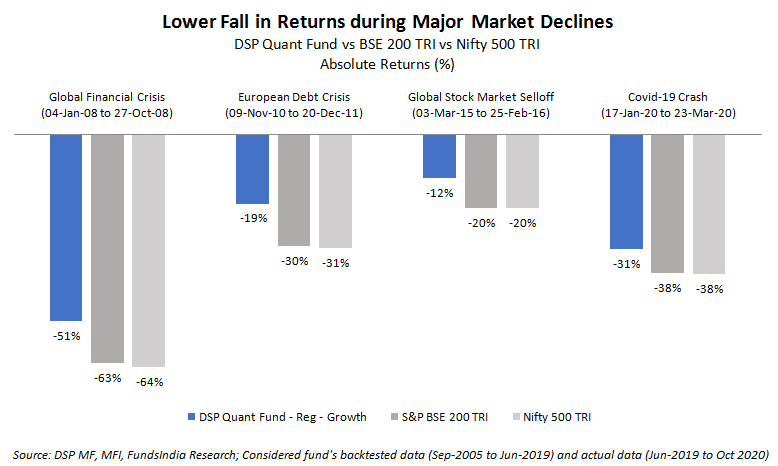
Much Lower declines during market falls indicating better risk management
DSP Quant Fund has a Downside Capture Ratio (DCR) of 70.8% against BSE 200 TRI and has a DCR of 69.2% versus Nifty 500 TRI for the period of Sep-2005 to Oct-2020. These indicate that the fund’s portfolio fell only around 70% as much as the benchmark indices during periods of declines.
During phases of major market declines in the past, the fund has evidently fallen lesser than the indices.
Even in the Intra-year Drawdown comparison, the fund has mostly fallen lower during the volatile periods within the years when compared to the benchmark indices.
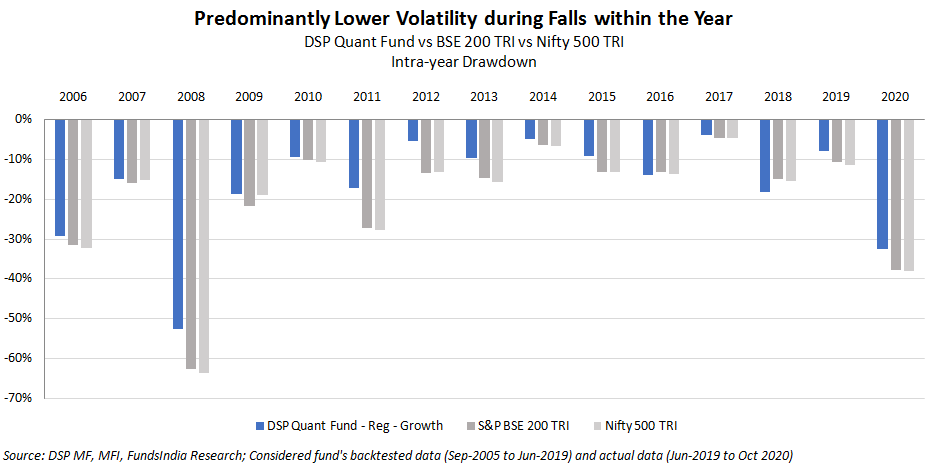
Thus, the fund does good in the risk management aspect as well.
Now, some caveats too…
The quant-model manages to mitigate most of the human biases, but there are some that could still creep in – most notable one being ‘the hindsight bias‘. Though the fund house has tested the quant-model across time horizons and across geographies – there is a risk that the model could have been overfitted to the past. To address this issue, the fund house does a periodic review and upgradation of the model. They also provide regular communication on any changes to the fund. But, it’s still a risk one should be aware of.
Further, the fund may underperform in short term phases where there are
- Sentiment driven rallies / Market Euphoria (Not backed by fundamentals) Example: 2007 Commodity Super-cycle peak and 2014 Change in Govt. regime
- Market reactions based on actual or expected changes in policy/regulation or events. Example: PSU Bank recap of Oct 2017
- The fund may not be able to fully capture ‘hope trades’ or ‘turnaround stories’ where actual historical numbers are poor but the market is pricing in a sharp future improvement.
We had an extensive discussion with Ms. Aparna Karnik, SVP and Head – Risk & Quantitative Analysis, DSP Investment Managers on our various queries pertaining to DSP Quant fund.
Do watch this interesting video for much more insights on the fund.
Suitability
- DSP Quant Fund is ideal for long term equity investors with a preference for rule based strategy with a ‘quality’ bias
- Investment time horizon of at least 5-7 years
- Can be a part of the “Quality” bucket
Summing it up
- DSP Quant Fund uses a quant model driven by a set of rules to invest in ‘good companies’
- Though the fund has a short real-world track record (Jun 2019 to Oct 2020), the same combined with the back-tested results (Sep-2005 to Jun-2019) help us derive our conviction on the fund
- The fund has shown strong outperformance with lower downside based on 2005 to 2020 data – but as with all backtests the caveats apply!
- Suitable for long term equity investors with investment horizon of at least 5 to 7 years and looking for a rule based equity portfolio with a ‘quality’ bias